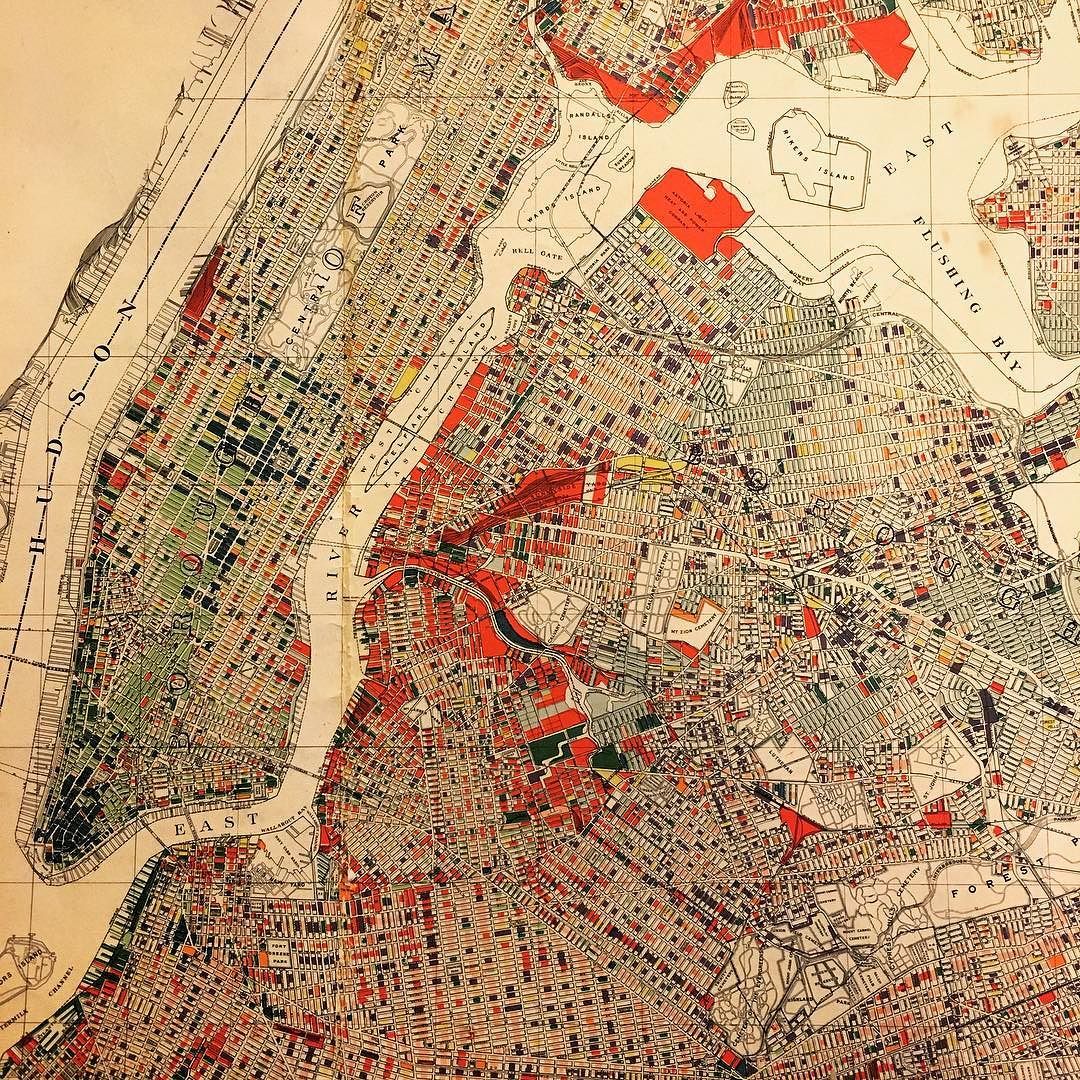
“Graphic presentation of data” from the 1934 Real Property Inventory Report, published by LaGuardia’s Committee on City...
“Graphic presentation of data” from the 1934 Real Property Inventory Report, published by LaGuardia’s Committee on City Planning, depicting the “predominant non-residential type” of structure throughout the five boroughs.
Dark blue offices crowd the southern tip of Manhattan, light green “Lofts” form a spine up the island, red “industries” line the waterfront, while vast swaths of outer Queens, Brooklyn, and Staten Island were still untouched and undeveloped, labeled “vacant” by the Committee.
#map #datavisualization #nychistory #cityplanning #urbanhistory #urbanplanning #gisbeforegis http://ift.tt/2by1VpA